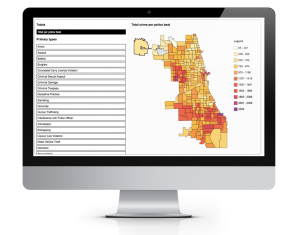
A follow up on my previous work with crime by police beat, adding the ability to switch between beat and district. A district is a much larger area and changes the perception of the underlying data set.
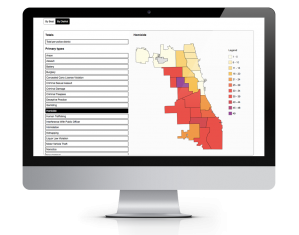

A follow up on my previous work with crime by police beat, adding the ability to switch between beat and district. A district is a much larger area and changes the perception of the underlying data set.
Ever since my first programming experience with AutoLISP, the variant of the LISP language intended for automating AutoCAD, I had wanted to do data analytics again. I have used Javascript to process data, with the main disadvantage being that it is a very resource intensive method and not exactly what Javascript was intended for when it was developed. I had heard about the R language dedicated towards statistical analysis and decided a distributed approach was warranted: using R to process my data sets and create data files, and a web front end for actually displaying the data.
Initially my goal was use a React based visualization library, but after encountering issues with the only one in widespread use dedicated towards geographic JSON, I decided to use D3.js with React simply managing my interface state.