Jeremy Moore

Front End Developer

Jeremy Moore
Skip to content
D3 visualization on computer screen

Combining R and D3.js Part 2

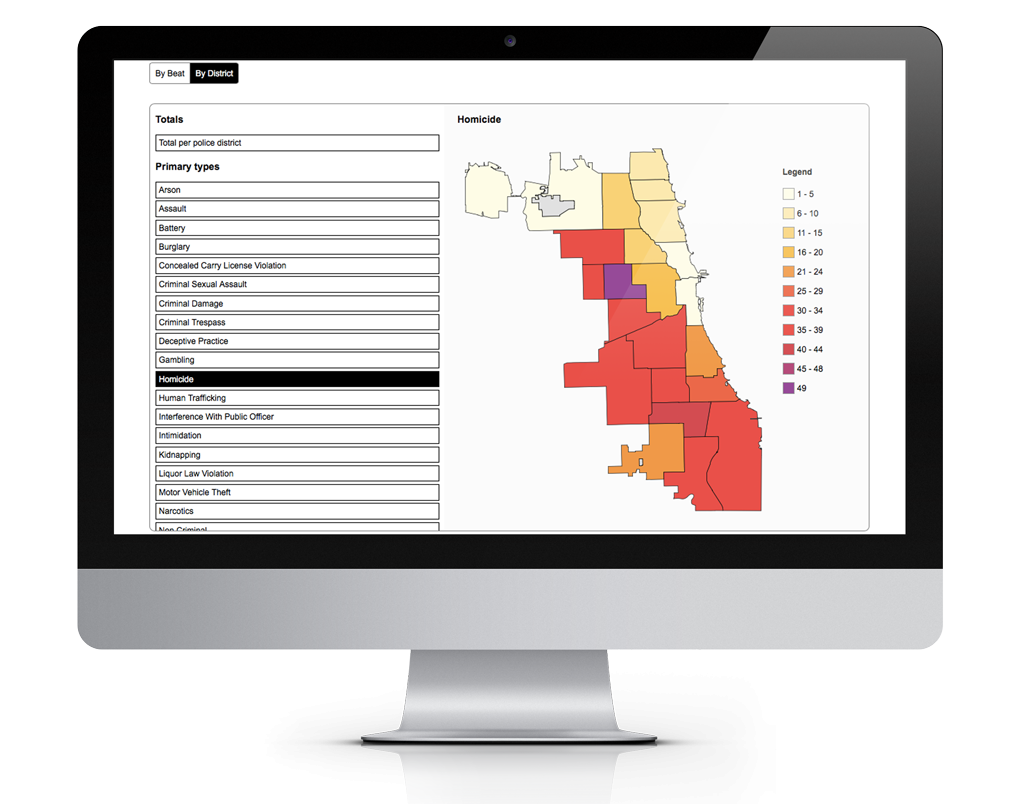
A follow up on my previous work with crime by police beat, adding the ability to switch between beat and district. A district is a much larger area and changes the perception of the underlying data set.
View the demo

Posted on 2017-07-162017-07-16Categories Tangled Web We WeaveTags D3js, geoJSON, R, React, SVG

Post navigation

PreviousCombining R and D3.js Part 1
Toggle Sidebar

Menu

  • About
  • Web
  • Photography
    • Bellingham, WA
    • Buffalo
    • Chicago
    • Los Angeles
    • New York
    • Toronto
    • Washington, DC
  • Design + Plan
    • More Transit and More
    • Undergrad
    • Grad
    • 3D
  • Contact

Connect

  • Codepen
  • Twitter
  • Linkedin
  • Github
  • Flickr
  • 500px
  • Blog: Photography
  • Blog: Web
  • Blog: Transit
  • Undergrad
  • Grad
  • 3D

Recent Articles

  • Combining R and D3.js Part 2
  • Combining R and D3.js Part 1
  • Experience with ES6: Part One
© 2006-2023 Jeremy Moore. All rights reserved.
Proudly powered by WordPress | Theme: Espied by WordPress.com.